A study by DiSSGeA on the emotions behind pandemic cartography
18.02.2021
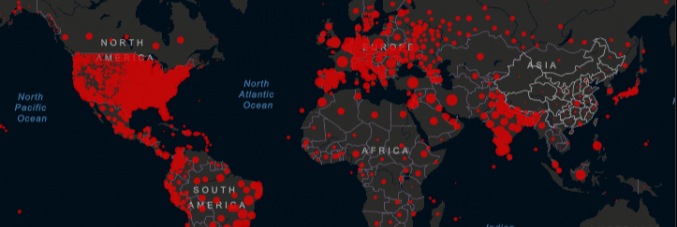
The spread of the pandemic includes the viral spread of images. Among such images are the cartographic visualizations of interactive maps, dashboards, infographics, and more, which have taken on a crucial role in society. Consider the iconic force behind the Johns Hopkins University dashboard that maintains a mapping of the coronavirus infection and death rates. Spatial representations have been the main focus not only for scientific, governmental, and media communication but for a more varied expression of the existential and emotional impact of the virus.
The research paper recently published by a group of UniPD scholars from DiSSGeA and its Centre for Advanced Studies in Mobility and the Humanities entitled Pandemic cartographies: a conversation on mappings, imaginings and emotions, stems from the timely observation of such heterogeneous cartographic materials starting from the beginning stages of the emergency.
Published in the journal Mobilities, the research investigated the mobility of different types of cartographic images viewed on the internet. The study emphasizes dimensions of trauma emerging from the emotional expression of colour in mapping, the sense of solidarity built through digital cartographic tools, the media visualization of the infected body of the nation, as well as the creativity of artistic language in the construction of alternative mappings of the pandemic condition.